Hydrogen Generation Industry ESG Thematic Report, 2022
Sustainability Assessment, Policies & Regulations, ESG Issues, Company Profiles, Benchmarking, SWOT, Company ESG Disclosure Scores
- Published Date: Jul, 2022
- Report ID: Astra-100108
- Format: Electronic (PDF)
- Number of Pages: 96
Industry Sustainability Outlook
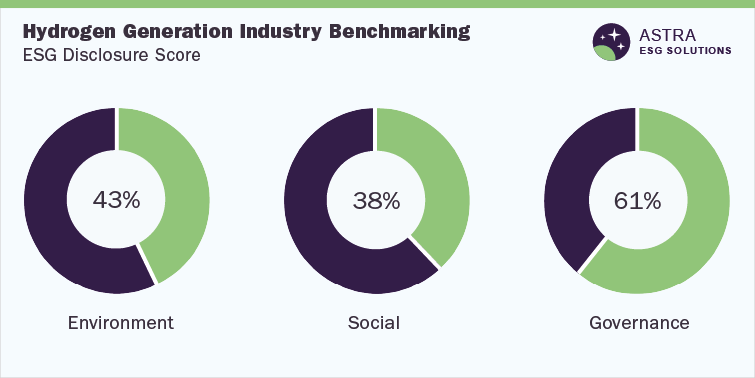
The average ESG disclosure score for the hydrogen generation market stands between 40% and 50%. Top companies within this industry performed well across corporate governance pillars along with reporting transparency. This conclusion is based on the analysis of more than 60 Environment, Social, & Corporate Governance (ESG) parameters within our ESG scoring framework. Alongside Linde PLC and Indian Oil Corporation, six other market leaders were part of our research.
Hydrogen as a clean fuel produced in fuel cells is more desirable for the generation of electricity and transportation, as it can be derived from several domestic resources, including nuclear power, natural gas, and biomass. Following the desirability of hydrogen as a clean fuel, leading companies in the industry are focused on decarbonization efforts through clean energy projects.
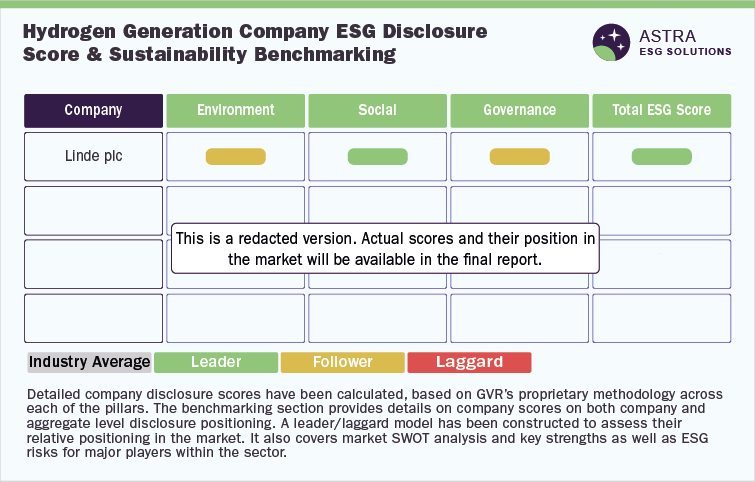
Company ESG Benchmarking
This research identified that only four companies, including Indian Oil Corporation and Linde PLC, scored above the average industry score while the four other leading companies are required to improve their ESG transparency & reporting, as they scored well below 40%. Our research found that the majority of the ESG disclosures have been made around the governance metric, with Linde PLC being a leader in this sector when compared to other companies, such as Bloom Energy Corp & Air Liquide, from an overall ESG disclosure point of view.
While 75% of the companies in the industry have disclosed their scope 1 and scope 2 emissions with targets to reduce them, more than 70% of the companies in the industry have career development initiatives for their employees. Further, most of the companies improved board independence in 2020 compared to the previous year, however, most of the companies do not have a Business Continuity Program (BCP).
Environmental Assessment
Since 1975, there has been a threefold increase in demand for hydrogen. However, its production poses significant consequences for the environment, as it is almost entirely derived from fossil fuels and around 800 million tons of CO2 equivalent emissions are released annually in hydrogen production. The enormity of hydrogen production is such that around 6% of natural gas produced globally goes into producing hydrogen.
The latest hydrogen production methods are focused on reducing environmental impact through methods like renewable liquid reforming, fermentation, photobiological water splitting, photoelectrochemical water splitting, and high-temperature water splitting. Certain innovations focused on producing sustainable hydrogen, such as renewable hydrogen—Hydrogen-to-X method (producing hydrogen from renewable electricity and blue hydrogen)—have increased R&D in this field. Furthermore, hydrogen’s point-of-use emissions are zero and as a fuel & energy storage medium, it is a vital part of the clean energy future.
Provided below is a research on a few of the organizations under environmental benchmarking, concerning their scope 1 and 2 emissions
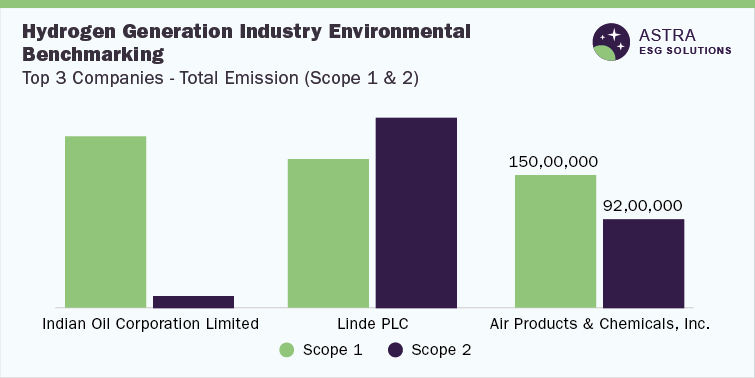
All the top three companies in their environmental assessment were identified to have strategies supporting the generation of hydrogen fuel. For instance, Linde PLC, one of the industry leaders, has a clean hydrogen strategy, which is overseen by its board of directors who also oversee the company’s climate change policy. Positively, including Linde PLC, 75% of the companies in the industry have direct oversight of climate-related risks through their board, showing their active commitment to ending climate change. Furthermore, while the world’s leading chemicals and gases seller, Air Products and Chemicals Inc, has partnered with the hydrogen council to generate hydrogen from renewable energy sources, Indian Oil Corporation uses advanced technology, including green power generation, energy efficiency, & off-grid/grid connected projects, to boost hydrogen fuel generation. The company’s sustainability efforts to achieve carbon neutrality have so far helped it attain a 10% reduction in overall emissions in 2020.
Our research revealed that only 50% of the companies in this industry have ISO 14001 Environmental Management System in place. Except for Indian Oil Corporation, which has 100% of its sites certified with ISO14001, other companies, including Linde PLC, have only a few of their engineering sites equipped with ISO14001 certification. Furthermore, only the top five companies in this sector are supporters of Taskforce on Climate-related Financial Disclosures (TCFD) recommendations.
Social Assessment
Within the social component of ESG, improvements around the value chain of a firm, increase in employee engagement & retention, and the method of promoting business continuity are mainly measured. Around seven out of eight companies, i.e., 87.5% of the companies in the industry, have a Human Rights Policy integrated in their supply chain. However, barring some industry leaders, such as Linde PLC and Indian Oil Corporation, none of the other companies have a supplier code of conduct. This outlines opportunities for improvement in terms of value chain operations among other competitors in the industry. Few companies like Bloom Energy Corporation, despite having a lower social score, have a publicly available business partner/supply chain policy and furthermore conduct supply chain audits. Similarly, other companies require audits in place to follow due diligence regarding supplier code of conduct.
Provided below is a research on a few of the organizations under social benchmarking concerning the employee turnover rate
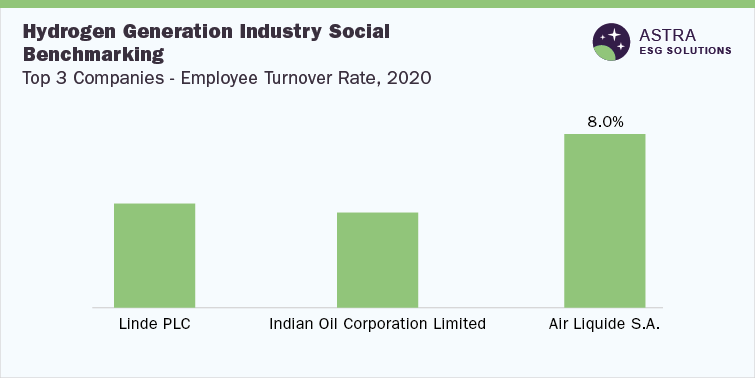
Among companies researched in accordance with the social metrics, Linde PLC leads others with a social score well above 80%. Typical hazards in the hydrogen fuel cell industry are fire & explosion and electrical & freeze burns, which necessitate institutionalizing health and safety management systems in the workplace. Linde PLC sets the example as an industry leader in social disclosure by aligning its product handling and work process with international safety & environmental standards, including the ISO 14001 certification, and the integrated SHEQ management system. These international standards have helped the company achieve a significant reduction in accident frequency rate since 2018. Like Linde PLC, Indian Oil Corporation is ISO 45001 certified and has an internal team for conducting safety audits. Indian Oil Corporation has witnessed a significant reduction in the accident frequency rate among its employees in 2020 compared to the 2019 baseline.
Employee engagement surveys help companies enhance their workplace culture and drive employee success. Among industry leaders, despite both Linde PLC and Indian Oil Corporation having similar employee turnover rate, the former had managed to decrease the rate in 2020 compared to 2019, whereas Indian Oil Corporation recorded increased employee attrition in 2020 compared to 2019. Another industry leader, Air Liquide, recorded a significantly high turnover rate even though the company boasts of diverse employee benefits and engagement & well-being programs. At the same time, barring Linde PLC and Indian Oil Corporation, none of the other companies had an employee engagement survey in place, which highlights the significant scope for improvement in this area. Our research also found that most of the companies have a clear approach to nurturing and improving talent in the workforce with effective career development programs in place.
Governance Assessment
Financial outperformance is long discussed to have a strong relationship with ESG metrics; however, the governance factor is identified to have a more substantial impact on this factor (financial outperformance), based on empirical evidence. Governance metrics affecting the valuation of corporate businesses are corporate governance, code of business conduct, risk & crisis management, tax strategy, supply chain management, and policy influence & materiality.
The industry leaders in social benchmarking are Air Products and Chemicals Inc., with around 80% governance score, followed by Air Liquide, which has a score well above 70%. However, in terms of female representation, Air Liquide has the highest proportion of females on board, at more than 50%, which is higher than the industry leaders Air Products and Chemicals Inc.
Provided below is research on a few of the organizations under the governance benchmarking concerning their female representation on the board
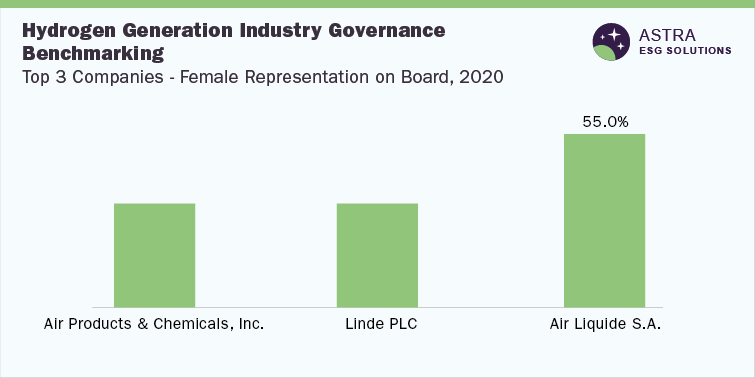
In terms of evaluating corporate governance, the interests of minority stakeholders play a crucial role. In line with this, our research finds that of the three industry leaders in the sector, Linde PLC has the highest board independence, with the board made of 92% independent directors. Another industry leader, Indian Oil Corporation, has only 36.36% independent directors on board, which suggests a lack of transparency and objectivity on the board.
Among the top three leaders in this metric, Linde PLC is the only company that does not have a Business Continuity Program (BCP) in place, despite being one of the leaders in the overall ESG reporting space. This is the same among the four other companies in the industry, as only around 30% of the companies have outlined a BCP. Following this, almost 50% of the companies in the industry have reported on cybersecurity programs institutionalized in their firms, which helps them identify risks in the organization. This is a space of opportunity for other firms that do not have a cybersecurity program in their organization.
Country ESG Outlook
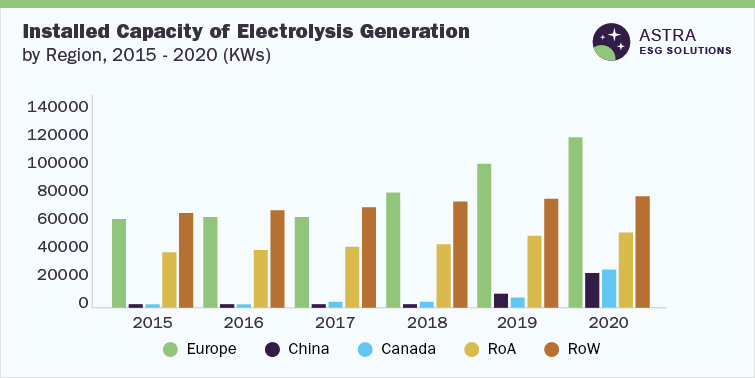
Globally, hydrogen is generated from diverse resources, which include both renewable & nonrenewable resources. Currently, most of the hydrogen is derived from fossil fuels, leading to considerable emissions of greenhouse gases. However, hydrogen generation from renewable resources, such as biomass, electrolysis, fuel cell, and water/steam, requires renewable-based technologies, which appear energetically and economically promising according to recent research. Water electrolysis is as promising as the hydrogen derived from renewable-based technology, only to the extent that the source of electricity should be renewable. If the source of electricity is highly carbon intensive, then the whole process can result in significant emissions. Electrolyzers are existing technology for industrial use to produce chlorine & alkali, and they have significant potential for being used to produce hydrogen as a by-product. Policies supporting hydrogen generation have increased in the EU, largely with electrolysis projects estimated to generate 170,000 tons of hydrogen by 2022. In the figure below, the global deployment of electrolysis capacity, based on region, from 2015 to 2020 has been provided.
From a legislation perspective, the EU’s upcoming binding agreement calls for the reduction of carbon emissions from hydrogen. In Asia, India aims to be a global distribution center for hydrogen, which is envisioned by the present Prime Minister of the country under the hydrogen economy initiative announced in 2021. The government of India has bold energy targets for producing green energy by 2030 and 2050. It targets to increase non-fossil power capacity to 500 Gigawatt by 2030 and achieve net-zero emissions in the country by 2050. Furthermore, the petroleum ministry has classified hydrogen under mineral oils and suggested amendments to Oilfield Act, 1984, and Oilfields Amendment Bill, 2021. This move is to enable the government to provide licenses for the production & exploration of hydrogen and facilitate ease of doing business. However, India still awaits a legal framework that fosters streamlined production of hydrogen in the country. China does not have any policy supporting hydrogen generation; however, Japan has a basic hydrogen strategy and South Korea has a Hydrogen Act as well as a roadmap for using hydrogen energy.
Hydrogen Generation Market Overview
The global hydrogen generation market size was estimated at USD 129.85 Billion as of 2021 and is expected to continue to grow at a Compound Annual Growth Rate (CAGR) of 6.4% from 2022 to 2030. The demand for hydrogen generation globally is expected to be driven by an increase in government regulations and a rise in demand for cleaner fuel. The primary quality of hydrogen being an effective carrier of energy makes it penetrable into novel markets. The global hydrogen generation market is driven by demand from rising awareness in healthcare and acceptance of cloud-based technology. The highest revenue for the hydrogen generation market is from the Asia Pacific region where R&D initiatives have been constant. Moreover, the analysis of ESG-related programs, metrics, and targets of major companies in the industry has shown that there is significant demand for transparency in reporting and sustainability.
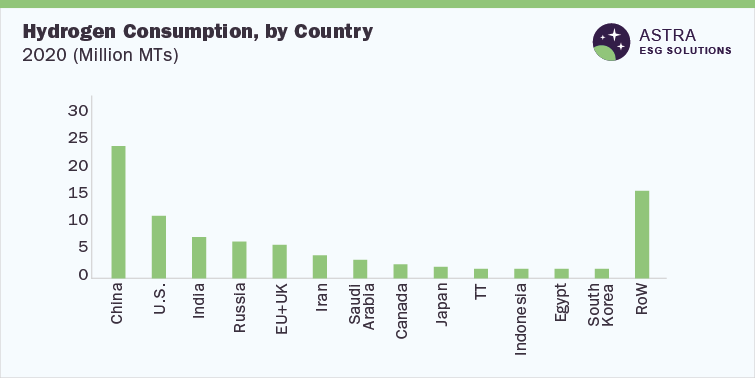
Worldwide, hydrogen consumption has rapidly increased across several developing countries, especially China, which still does not have a policy supporting hydrogen generation. The below figure provides a brief estimate of hydrogen consumption across the globe in terms of million metric tons.
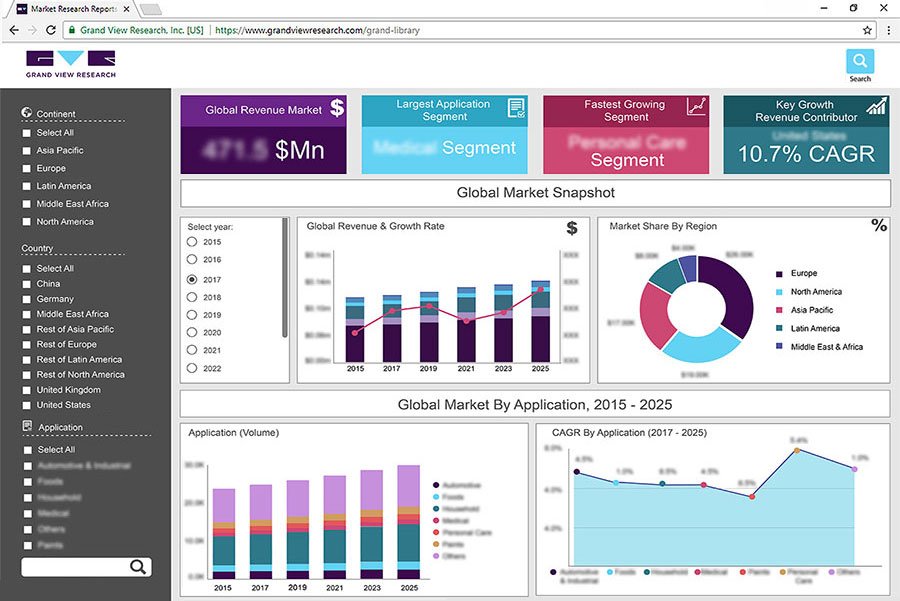
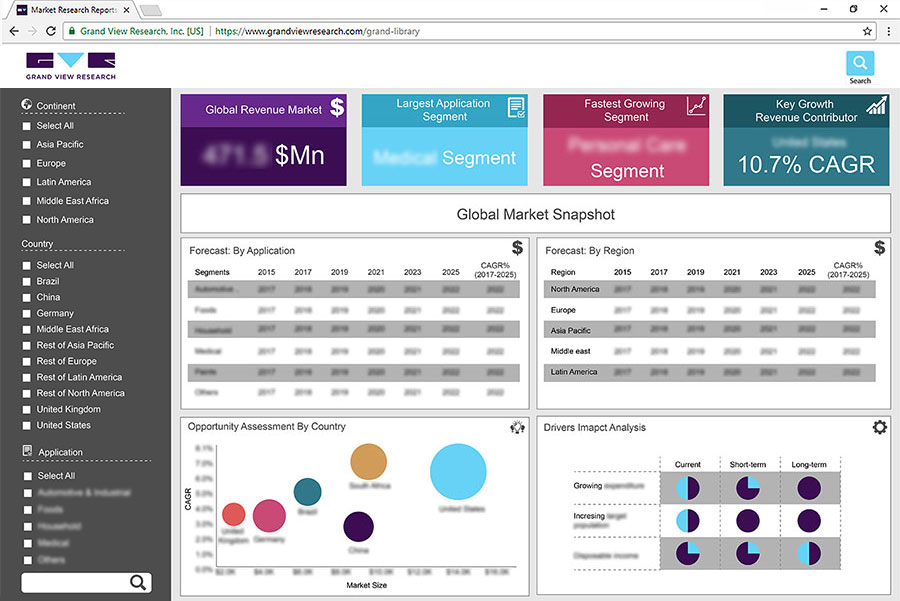
GET A FREE DEMO
This Free Demo includes an overview of our proprietary ESG dashboard with industry & company benchmarking data, country performance, technological innovations, market estimates & forecasts. See for yourself!